Parachutes and Cup Handles
This web page addresses the question of whether the parachute charts can indicate whether or not a cup handle
will fail. For the purposes of this discussion, it will be assumed that the creation of a cup handle begins
when the price of the S&P hits the ceiling of its daily APC chart. It's been observed many times that if the
channel is wide at the time of the collision, the S&P will likely turn down and begin a significant down trend.
But what happens when the channel is narrow? Will the S&P simply recover from the hit on the ceiling and then
continue up, or will it bounce up and down and gradually create a down trend ?
The next two examples help to answer this question.
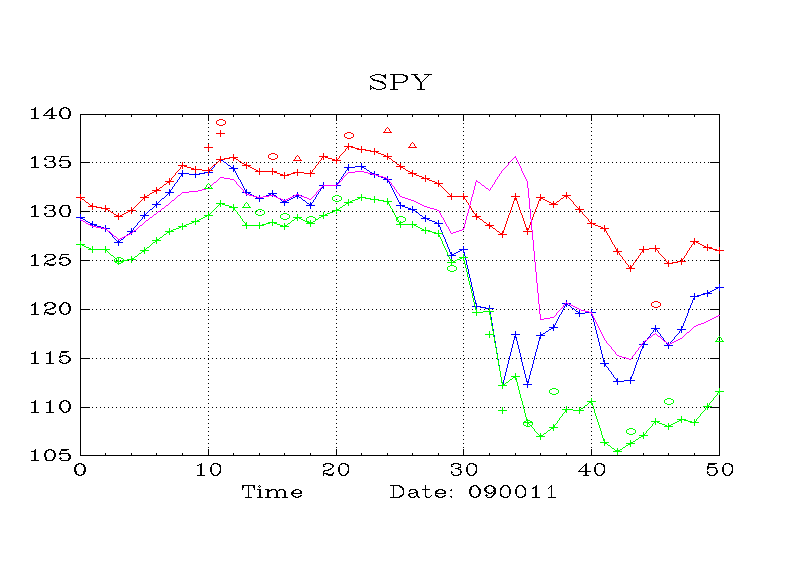
Example 1
This example shows a case in
which the S&P declined rather sharply after hitting the ceiling, but then hit the floor and resumed (or began)
an uptrend. Whether it resumed its old uptrend or began a new one depends on whether you believe the sharp
sell-off constitutes a down trend.
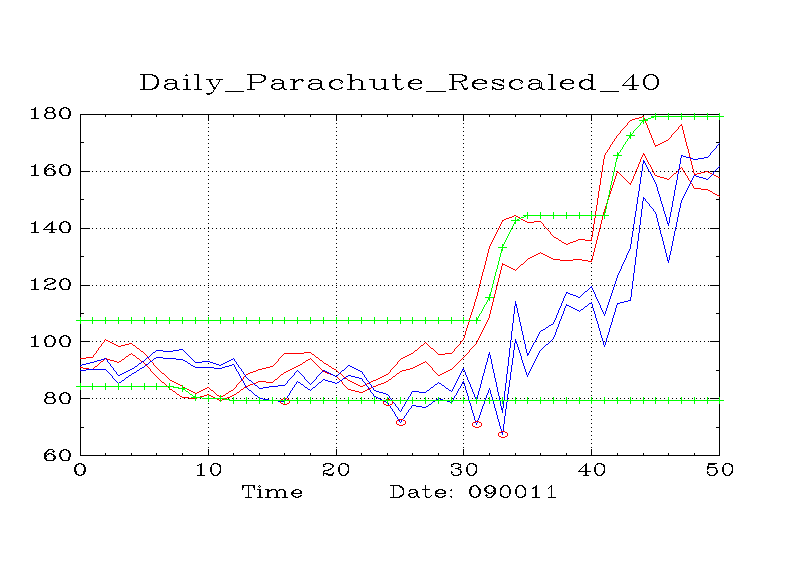
What's interesting about Example 1, is that the 40 period parachute never gave the signal for a correction.
Therefore, one can assume that it would have been safe to hold an XIV position throughout the creation of
the cuphandle and thereafter.
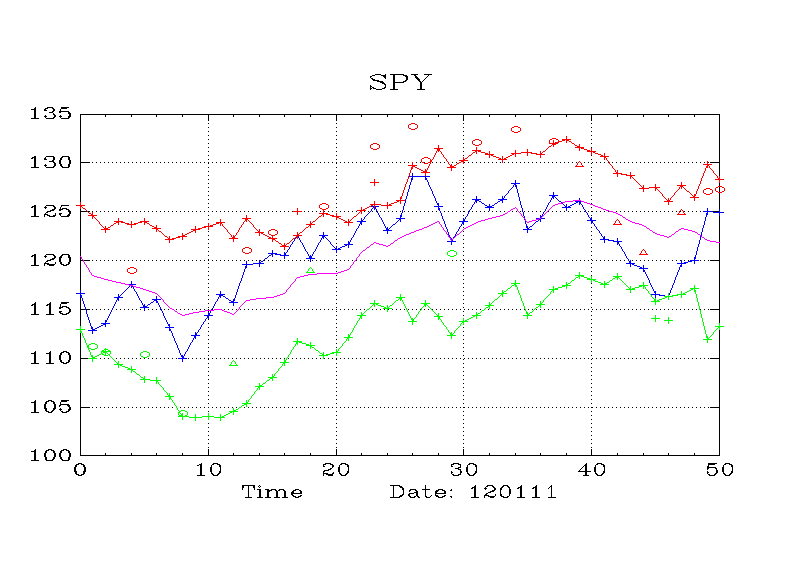
Example 2
This is an example of the case where the S&P hits the ceiling on the daily APC chart and then gradually
cultivates a down trend over a period of a few weeks. The hit on the ceiling came at ticks 10 and 11.
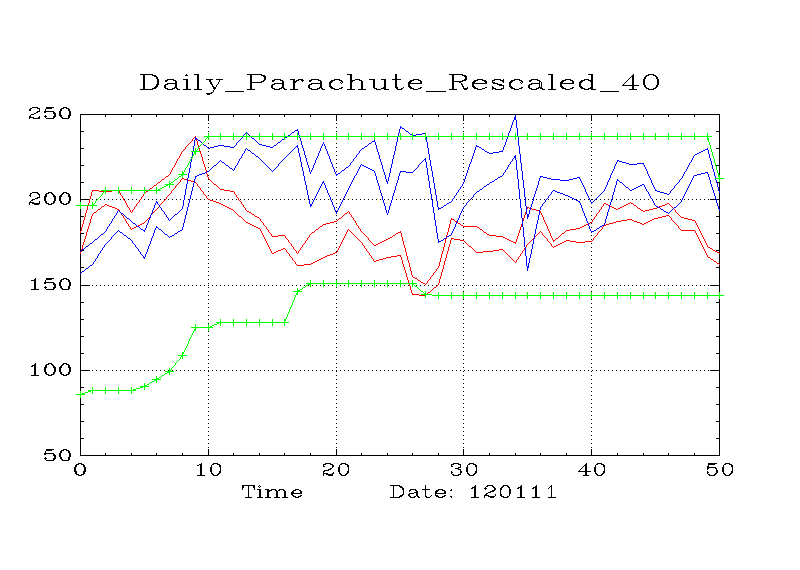
Here, the parachute indicator is an enormous help,
because it gave indications at ticks 24 and 25 that there is likely a significant correction on the way.